| Download the CDF Player: If the Wolfram Mathematica Computable Document Format (CDF) Player is not already installed on your computer, CLICK HERE to download the CDF Player installation file for your computer's operating system. |
Download the CDF activity file: After installing the CDF Player, CLICK HERE to download the CDF activity file for this exercise. When the file is opened with the Player, the first nested plot will appear, as illustrated by the static, screen-captured image below, and the pulldown menu can be used to navigate to other nested plots, as listed below:
Rectangular hyperbolic plot Double-reciproclal plot Hill plot Scatchard plot
|
Analyze enzyme catalysis with a reversible inhibitor present in the reaction mixture: In the figure below, the initial reaction velocity at time zero, Vo, is recorded as a function of the initial substrate concentration at time zero, [So]. It is assumed that one of three types of inhibitor is present in the reaction mixture: a competitive, uncompetitive, or mixed (noncompetitive) inhibitor, as indicated by the figure legend on the right. Such inhibitors are assumed to bind enzyme reversibly and non-covalently. Variations in the following enzyme-related or inhibitor-related parameters can be adjusted with the horizontal sliders:
|
Static image of the top-nested plot displayed after the CDF activity file is opened with the Player.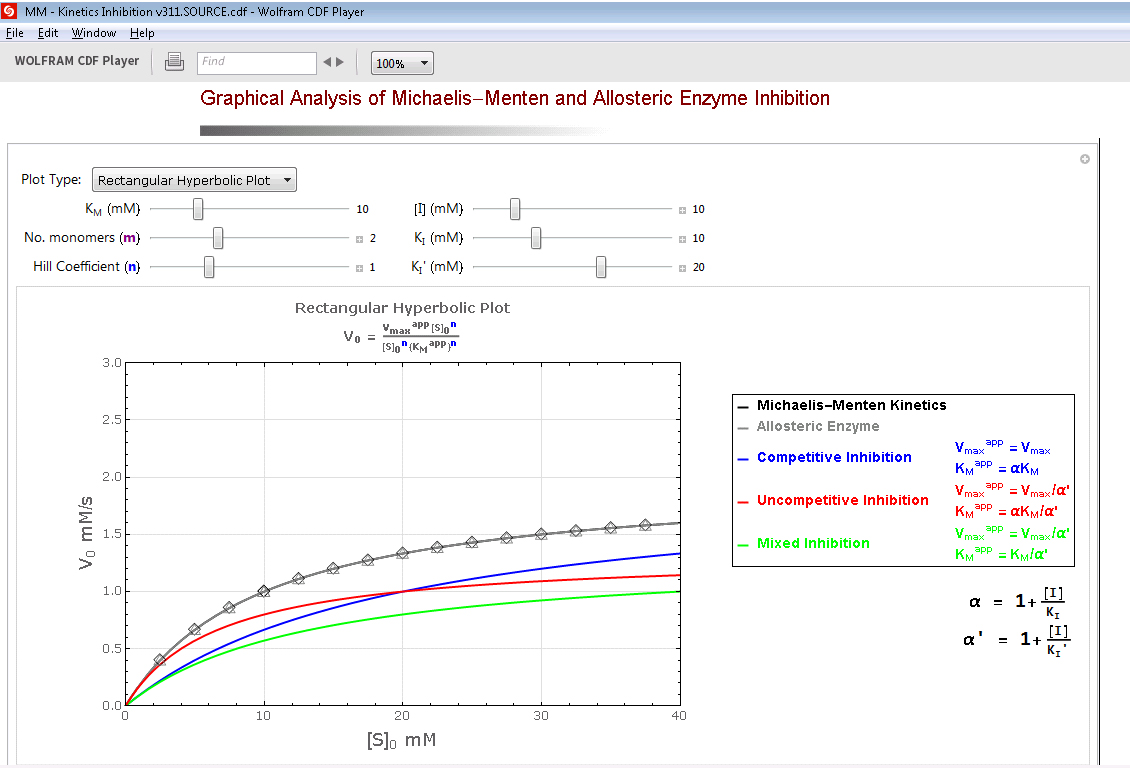 |
| Nicholas Clayton and Duane W. Sears (c) 2011, University of California Santa Barbara. |